|
||||||||||||||||||||||||||||||||||||||||||||||||||||||||||||||||||||||||||||||||||||||||||||||||||||||||||||||||||||||||||||||||||||||||||||||||||||||||||||||||||||||||||||||||||||||||||||||||||||||||||||
| ||||||||||||||||||||||||||||||||||||||||||||||||||||||||||||||||||||||||||||||||||||||||||||||||||||||||||||||||||||||||||||||||||||||||||||||||||||||||||||||||||||||||||||||||||||||||||||||||||||||||||||
Topography and geography dataGeographical and topographic data used within the project are threefold:
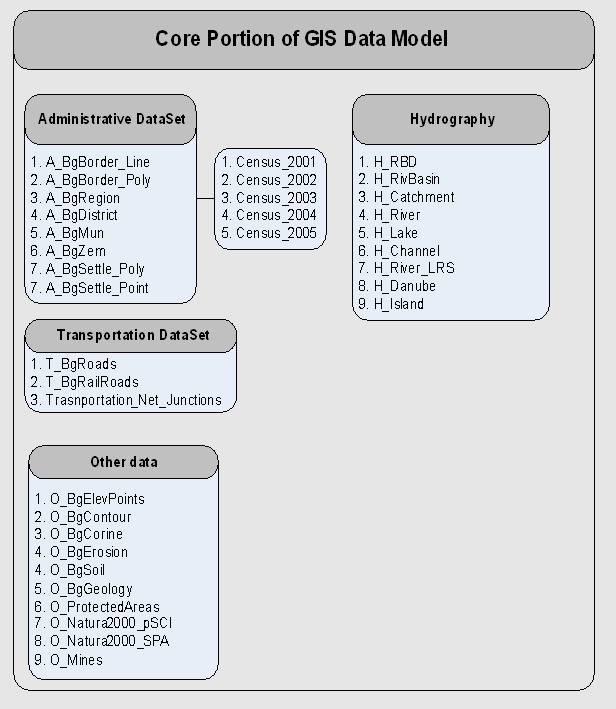
1. GIS set upOne of the first task which has been performed for the project was to gather all available geographical data within a single GIS geodatabase under ESRI Arc GIS 9.2 ® Topographic maps in scale 1:5000 in raster format have first been obtained (purchased and rasterised) all along the river reaches where we had to do the cross-section surveys according to the ToRs and its modifications proposed and agreed after the inception phase. For hydraulic modelling we have to use a scale of 1:5000 or less and an accuracy in elevation data of 10cm. 328 topomaps in scale 1:5000 were available at first from NIMH which cover most of the required area (Fig.2).
After the modification and selection of new cross sections in order to cover the whole flood plain area which will be modeled, an additional set of 44 topomaps was purchased and rasterised. Other raster maps with scales 1:25000 and 1:100 000 covering the study area have also been integrated. A DEM (digital Elevation model) at 70m resolution has also been collected and integrated in the GIS database. Its use was limited to basin analysis for hydrologic modelling. Note that it may also be used for eg satellite images orthorectifications, snow cover monitoring or distributed hydrological modelling in the future. Other cartographic data have been gathered from the Geodatabases of the Basin directorate in Plovdiv. They include the river network reaches, and the sub-basin division of the global watershed. This database have been established with a varying quality corresponding to a scale from of 1:50 000 to 1:200 000. Most of these data from EARBD have been produced within a cooperation project with the Japan International Cooperation Agency (JICA).
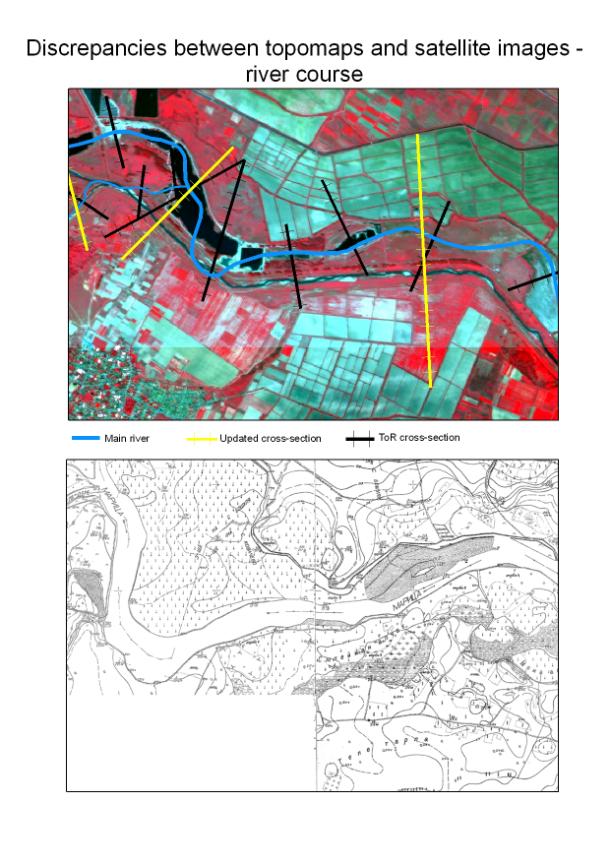
All the hydro-meteorological measuring stations are included within this database as punctual data. Eight cross sections data which have been surveyed previously on the Tindja river within this JICA project have also been collected. Each water level gaging station has also a cross-section profile (which provides about 16 other cross sections). The elevation of the water ladders was partially validated / corrected during the survey work. Most of the topographic maps are from the 1960s – 1980s. Consequently, numerous modifications have occurred which were pointed using recent high resolution satellite images (SPOT and quickbird mainly) that we could find and consult freely (they were lent to us with restrictive conditions for temporary consultation only from the Remote Sensing Application Center – ReSAC Bulgaria). Landsat satellite images (15m spatial resolution) from 2000 – 2001 were obtained freely from the Global Land Cover Facility. These satellite images were then used for updating of the river courses, which corrected version was included in the Geodatabase and delivered to the beneficiaries. The comparison with the satellite images of the river layout of the database showed some discrepancies with reality (Fig. 3 and Fig. 4) : These differences are due to the digitization which was done on old maps at too small scales. We had to correct the digitized stretches of the two main rivers and the selected tributaries within the geodatabase in order to have coherence between the topographic data, the surveyed data and the channel courses of the hydraulic model. The data quality of the secondary river network for hydrologic modelling was estimated correct for this purpose. For Hydraulic modelling purpose, we digitized the elevation data of the topographic maps in order to derive a TIN -DTM which was then used for flood mapping.
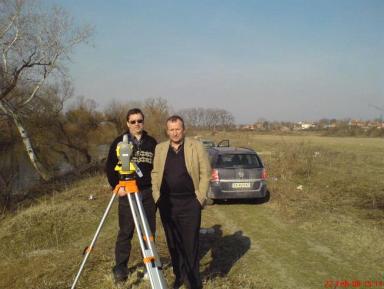
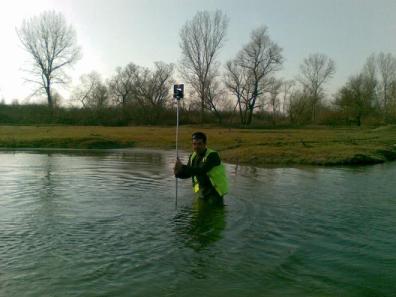
2. Topographic SurveysDuring the inception phase, we selected carefully the 300 cross sections to be surveyed (out of 1000 possible) for building the hydraulic model. Note that 260 cross sections were to be surveyed according to the ToRs After an analysis performed together with NIMH and the Basin Directorate in Plovdiv, the cross sections repartition has been modified to certain extend from those indicated in the TORs. In order to give room for project interface with future Turkish and/or Greek projects of Maritza / Tundja modelling, we reserved about 15 cross sections among the 300 to be surveyed on the Bulgarian banks of both rivers for the “along-the-border” part of the river reaches, mainly at Greece-Bulgaria border. It was however not possible to cross the border during the surveys and these cross sections are thus only partially measured and have not been used for modelling. The choice of the cross sections followed specific rules corresponding to hydraulic modelling constraints. CS were put upon all obstacle as weirs or narrow bridges for instance. A higher density of cross-sections was selected up- and downstream of (flood prone) cities and settlements. The density in cities may be lower because watercourses are more stable in urban areas. A detailed methodological specification for the survey work and of its quality control for the team which performed the survey was produced (see annex of Inception report). Each cross section to be surveyed has been precisely defined using maps and satellite images to account for modification of the river courses and of new man made structures (see picture above) and presented on a single slip joined with the survey ToRs. These 300 slips precise the position (with a topomap extract) and the extension of the cross section to be surveyed. The team of surveyors consisted in 8 geodesist non key experts which we selected with the support of our geodesist key expert. The team was set up mid-December. Downstream Svelingrad onto the border several cross-sections were selected to extend the hydraulic model until the border. These cross-sections will be combined with topographical information in order to “route” the flood wave until the Bulgarian-Turkish-Greek border. Cross-sections were selected for gauged tributaries only. We also took into account the tributaries were new automatic station will be installed in 2008. Cross-sections will be measured from the junction in upstream direction until the first hydrological gauging station. The density will be less compared to Maritsa and Tundja river. Because of bad whether conditions the surveys were done from February to the end of June. After quality checking we had to have about 50 of the cross sections corrected or extended back in the field. The final delivery was done in August. The table hereafter provides the number of cross sections selected on each main river and its tributary.
In red: Tributaries in the ToRs which were not selected
Example of cross section in Excel File
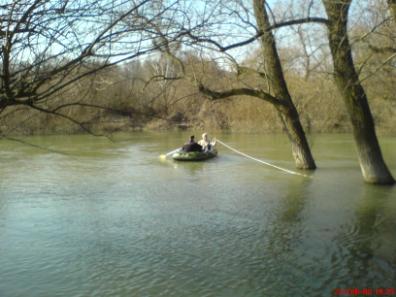
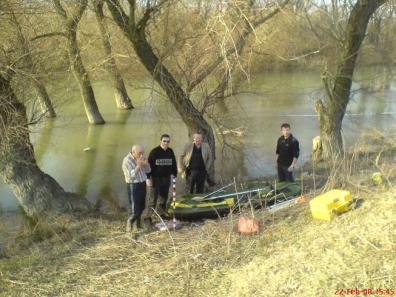
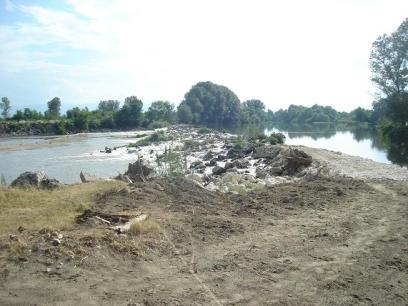
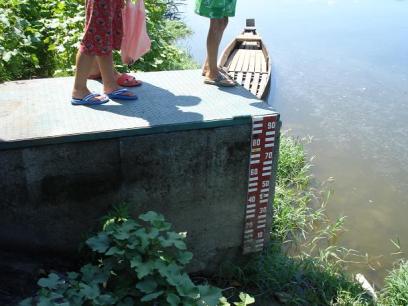
Some Field pictures
|
||||||||||||||||||||||||||||||||||||||||||||||||||||||||||||||||||||||||||||||||||||||||||||||||||||||||||||||||||||||||||||||||||||||||||||||||||||||||||||||||||||||||||||||||||||||||||||||||||||||||||||
|
||||||||||||||||||||||||||||||||||||||||||||||||||||||||||||||||||||||||||||||||||||||||||||||||||||||||||||||||||||||||||||||||||||||||||||||||||||||||||||||||||||||||||||||||||||||||||||||||||||||||||||