|
|||||
| |||||
The flood forecasting system1. OverviewFlood forecasting systems are basically similar in their philosophy to what is done for meteorological forecasts : From a general situation that is observed at several points (water levels, discharges, rainfalls, snow cover, soil moisture,…) the purpose is to know how the river situation will be in one or several days. For this scientists make use of numerical models. On one side, the forecast for large river is somewhat simpler than in Meteorology : large river system are more predictable than the atmosphere : Flood waves propagate in rivers in a well known way which is rather easily modelled and routed (with the appropriate mathematical tools). However, floods are triggered mainly by rains and the response time of basins along the rainfall input may be short when compared to the time scale of flood propagation from upstream to downstream of the watershed. This means that the time scale of forecasting a flood situation varies along the distance where the triggering rainfall occurred. Rains which happened on August 2005 in the Ihtiman area in the upper part of Maritza basin generated a large flood which was felt in Svilengrad and Edirne more than 3 days later. In such case, the forecast was rather easy to make about 3 days in advance, as long as we had a hydraulic flood routing model at our disposal. 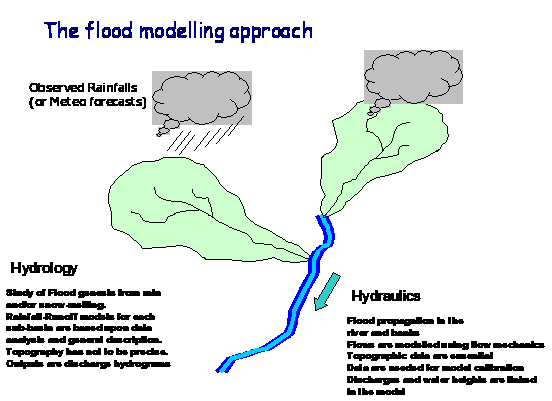
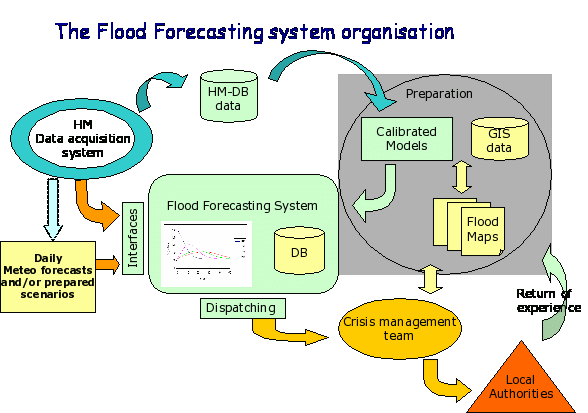
In Pazardjik, in August 2005, the flood wave struck about 12 hours after the paroxysm of the rainfalls. When intensive rains happen in the lower part of watersheds, or when one wishes to make forecasts in upper part of basins, the situation is quite different : the lead time of the basin to the rainfall may be short (say 5 hours), then the flood will have propagate on a shorter distance toward the place where the forecast is to be done (say 7 more hours). In this case we have only 12 hours between the Intensive rainfall and the flood occurrence at the considered point. Consequently, we see that, in order to anticipate fast developing floods, we need to take into account the rain forecasts from meteorological services. 2. Operation of the Flood Forecasting SystemFlood forecasting systems are based on several components as shown in the following picture :
Technically, the flood forecasting system by itself is made of:
In our case, the system is based upon:
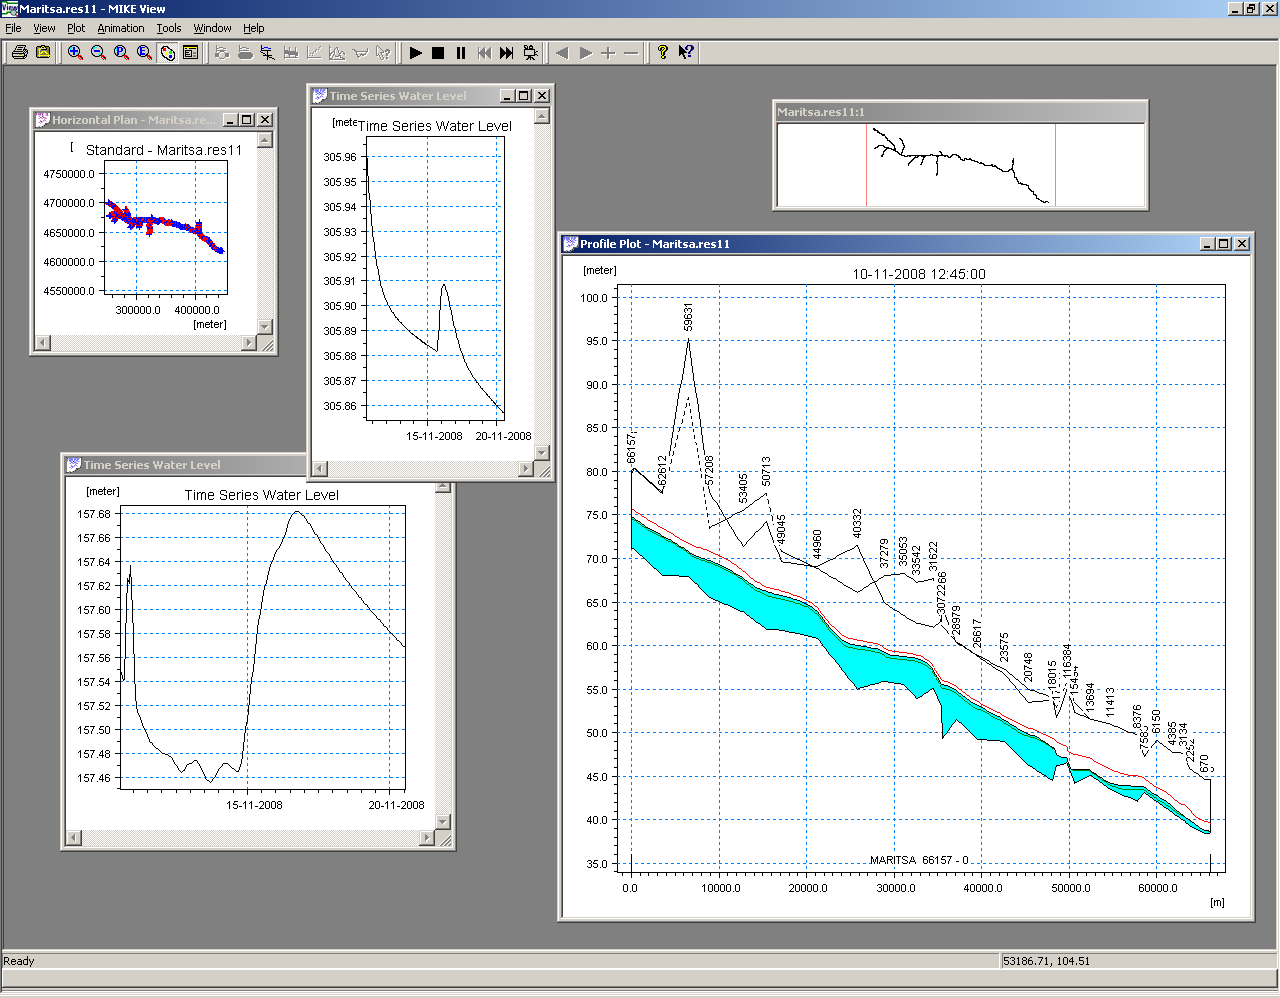
The basis of the flood computation in online or semi-online operating mode is formed by knowing the processes, which determine the water level (h) at any given location (x) in the river at a defined moment of time (t). This knowledge is formulated by three parameters:
First, the initial conditions of the operational flood forecasting system have to be properly described. To achieve this, before each forecasting simulation, the system should simulate at least the last ten days or on the basis of measured input data (rainfall and reservoir operation). Note that the hydrologic models which account for soil moisture and underground water fills necessitate even more length in order to be properly initialised. Second, a forecasting period of a number of days, dependent on the physical behaviour of the river, is simulated, using precipitation (rainfall or snow) data and a downstream water level. Third, the forecasted water levels can be improved by making use of a comparison between the measured water levels and computed water levels of the initial number of days in the calculation period (hindcasting procedure). Some "optimal analysis" between forecasted values and observed values must be done in order to produce new initial conditions to the model for the next run. 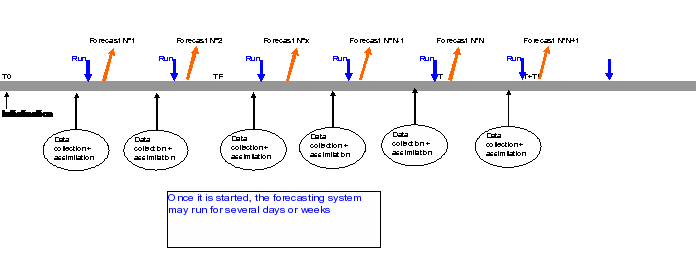 The initial and limit conditions accounting for new observations must be smoothed enough and biases optimally corrected (there are several techniques for this) so that no oscillation and divergence occur in the computing scheme at the next run. This procedure is called data assimilation: accurate and efficient data assimilation procedures are based on a general filtering update combined with error forecasting at measurement points. A general remark about the accuracy of the forecasting system is that the accuracy will degrade as the forecasting horizon gets further away. The decrease in accuracy is mainly governed by the lead-time between rainfall and runoff in the river system. This is because the accuracy of the rainfall prediction is less than the accuracy of the rainfall-runoff model, which is again less than the hydrodynamic flow model. This decrease in accuracy makes it important to re-run the whole forecasting model at least each day during the flood season. The front end system gather and analyses the necessary data toward the running model and launches it. In return it receives the forecasted values form the model and provide interfaces to the forecaster on duty who analyses the situation beside it automatically dispatches the computation results:
  The Data acquisition and dissemination interface functionalities 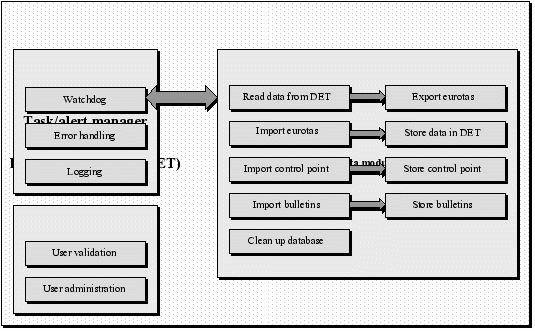 General Architecture Of the FF System 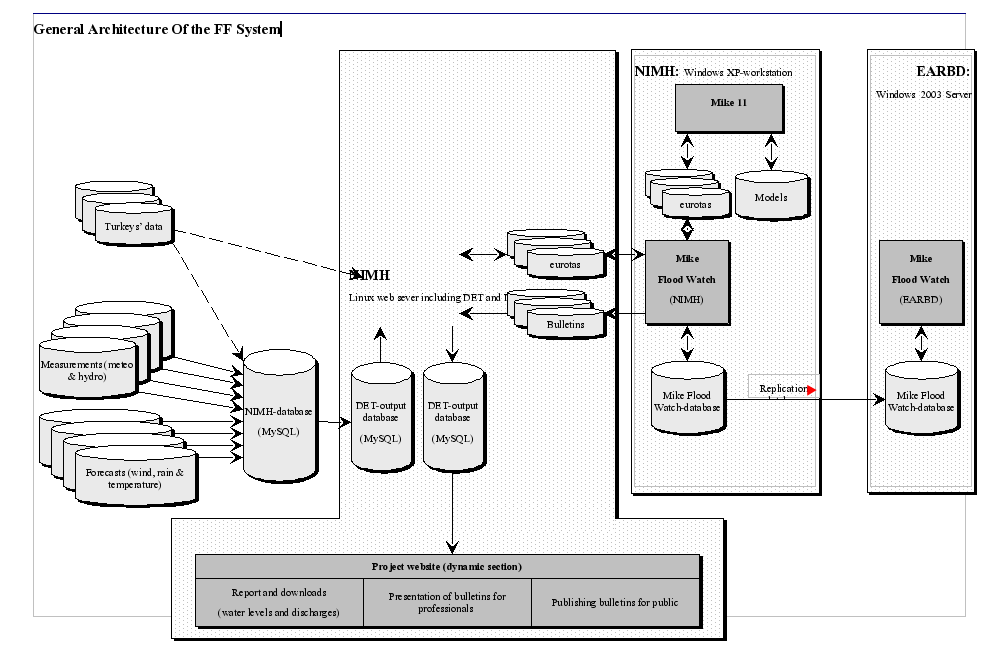 |
|||||
|